
High value council tax surcharge: constituency-level impact
The top 10 constituencies account for 35% of the £400 million annual revenue from the new surcharge on properties over £2 million.
Contents
The policy
Constituency-level estimates
Top 20 constituencies by estimated revenue
Geographic distribution
Distribution by surcharge band
Methodology and limitations
Data sources
Surcharge band assumptions
Uprating methodology
Key assumption: sales as proxy for stock
Behavioural effects
Conclusion
In the November 2025 Autumn Budget, the UK government announced a new high value council tax surcharge on properties valued over £2 million. The Office for Budget Responsibility (OBR) estimates this measure will raise £400 million in 2029-30.
Using 2024 Land Registry sales data, we estimate how this revenue will be distributed across Westminster constituencies.
Key findings:
- We estimate 553 of 650 constituencies have properties that would be subject to the surcharge
- The top 10 constituencies account for 35% of the estimated revenue
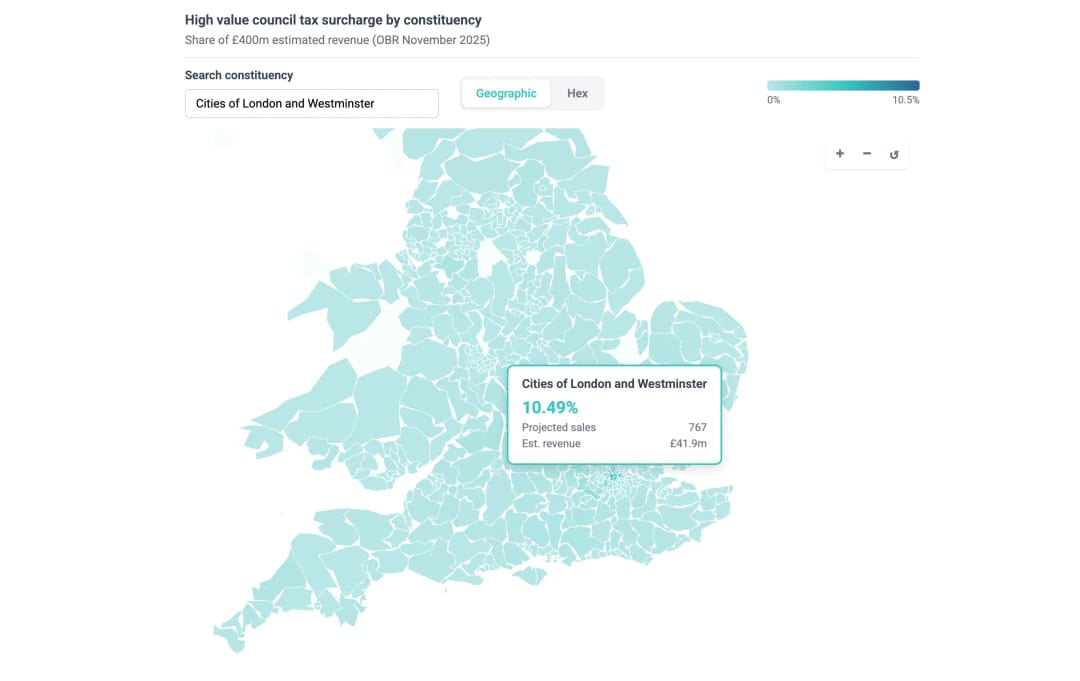
- Cities of London and Westminster alone accounts for 10% (£42 million)
- London constituencies account for 47% of total revenue
Explore the interactive map | Download the data
The policy#
From April 2028, owners of properties in England and Wales valued over £2 million (in 2026 prices) will pay an annual surcharge in addition to their existing council tax. The policy applies to properties valued by the Valuation Office Agency; it does not apply to Scotland or Northern Ireland, which have separate property tax systems. According to the OBR:
There will be four price bands with the surcharge rising from £2,500 for a property valued in the lowest £2 million to £2.5 million band, to £7,500 for a property valued in the highest band of £5 million or more, all uprated by CPI inflation each year.
The OBR does not specify the thresholds or surcharge amounts for the two middle bands. Bloomberg reports the middle threshold as either £3 million or £3.5 million (the article contains a typo with overlapping bands), with surcharges of £3,500 and £5,000, though does not cite a source.
For this analysis, we assume the following band structure:
The revenue flows to central government rather than local authorities.
Constituency-level estimates#
We estimate each constituency's share of the £400 million total by modelling the distribution of high-value properties using 2024 Land Registry sales data. We uprate sale prices to April 2028 levels using OBR house price forecasts (10.7% cumulative growth from 2024), apply the surcharge band structure (with thresholds uprated by CPI from 2026 to 2028), and allocate the OBR's total estimate proportionally based on each constituency's share of modelled revenue.
Top 20 constituencies by estimated revenue#
The top 20 constituencies account for 43% of the estimated revenue while comprising 3% of all constituencies.
Geographic distribution#
The map below shows the estimated revenue allocation by constituency. Darker shading indicates higher estimated revenue from the surcharge.
The concentration in London and the Home Counties reflects the geography of UK property wealth. Of the 553 constituencies we estimate have properties subject to the surcharge:
- 56 are in Greater London (accounting for 47% of estimated revenue)
- The remaining 497 constituencies share 53% of estimated revenue
London constituencies account for 47% of the estimated revenue while comprising 9% of all constituencies.
Distribution by surcharge band#
Revenue is concentrated in the highest-value properties:
Properties valued over £5.23 million (in 2028 prices) represent an estimated 25% of affected properties but contribute 41% of the estimated revenue due to the £7,500 annual surcharge rate.
Methodology and limitations#
Data sources#
- Property sales: UK Land Registry Price Paid Data for 2024 (881,757 transactions)
- Revenue estimate: OBR Economic and Fiscal Outlook, November 2025 (£400 million in 2029-30)
- House price growth: OBR November 2025 forecasts (2.9% in 2025, 2.5% in 2026-27, 2.4% in 2028)
- Constituency boundaries: MySoc 2025 Westminster constituencies
Surcharge band assumptions#
As noted above, the OBR confirms only the lowest and highest band rates. Our assumed middle band structure (£3,500 for £2.5m-£3m; £5,000 for £3m-£5m) is broadly consistent with Bloomberg's reporting. Since we allocate the OBR's total revenue estimate proportionally by constituency, these assumptions affect the distribution of revenue across bands but not the total or constituency-level allocations.
Uprating methodology#
The policy takes effect in April 2028. We uprate 2024 sale prices to 2028 using OBR house price forecasts (10.7% cumulative growth). We also uprate the thresholds from their 2026 base values using OBR CPI forecasts (4.5% cumulative from 2026 to 2028). This means the £2m threshold becomes approximately £2.09m in 2028 prices, and the band boundaries are similarly adjusted.
This approach captures the properties that would actually be subject to the surcharge when it comes into effect, accounting for both house price appreciation and the inflation-linked adjustment to the thresholds.
Key assumption: sales as proxy for stock#
This analysis uses property sales data to model the distribution of high-value properties across constituencies. We assume that the geographic distribution of high-value sales is representative of the geographic distribution of the high-value housing stock.
The OBR's £400 million estimate is based on Valuation Office data covering all properties, not just those sold in a given year. We allocate this total proportionally based on each constituency's share of modelled revenue from the sales data.
This approach is valid if high-value properties turn over at similar rates across constituencies. Annual property turnover rates of 5-10% of housing stock are typical, and there is no strong evidence that turnover rates vary systematically by constituency for high-value properties.
Behavioural effects#
The OBR's £400 million estimate incorporates behavioural responses including:
- Full pass-through of the surcharge into property prices
- Price bunching just below band boundaries
- Non-compliance and appeals
The OBR notes that these behavioural effects reduce revenue from other property taxes (stamp duty land tax, capital gains tax), which partly offsets the gross surcharge revenue in the early years of implementation.
Conclusion#
The high value council tax surcharge concentrates revenue collection in a small number of constituencies. The top 10 constituencies—all in London—account for over a third of the estimated £400 million annual revenue. This geographic concentration reflects the distribution of properties valued over £2 million, which are heavily concentrated in London and the South East.
Analysis by PolicyEngine. Data and code available on GitHub.

PolicyEngine's Co-founder and CEO